A problem we have as humans is our tendency to compare upwards. Especially with the advent of social media, it is all too easy to compare our situation with someone who is better off than us.
Unfortunately, you cannot avoid the fact that there will always be someone who is better off than you.
But, what you probably don’t think about is how much better off you are than others. It is not in our nature to compare downwards.
So, come with me on a journey of downward comparison.
What if I told you that, in all likelihood, you are within the top 10% for earned income worldwide?
Imagine this; your name is on a list of people who’s income outstrips 90% of the global population. So is mine and anyone who is likely to read this post. Welcome to the elite club.

How did you make it into this club? Most likely through the lottery of birth. Over half of the worlds population live on $10 or less a day, with roughly 1 billion people who live on less than $1 a day.
There are 30 countries, the UK included, with over 90% of their population falling into the global middle class.
To put this into perspective, let’s look at an annual income of £25,000. If you earn £25,000 then you are even more elite than the 10% club! You, you lucky chap, have breached the top 5% for global income!
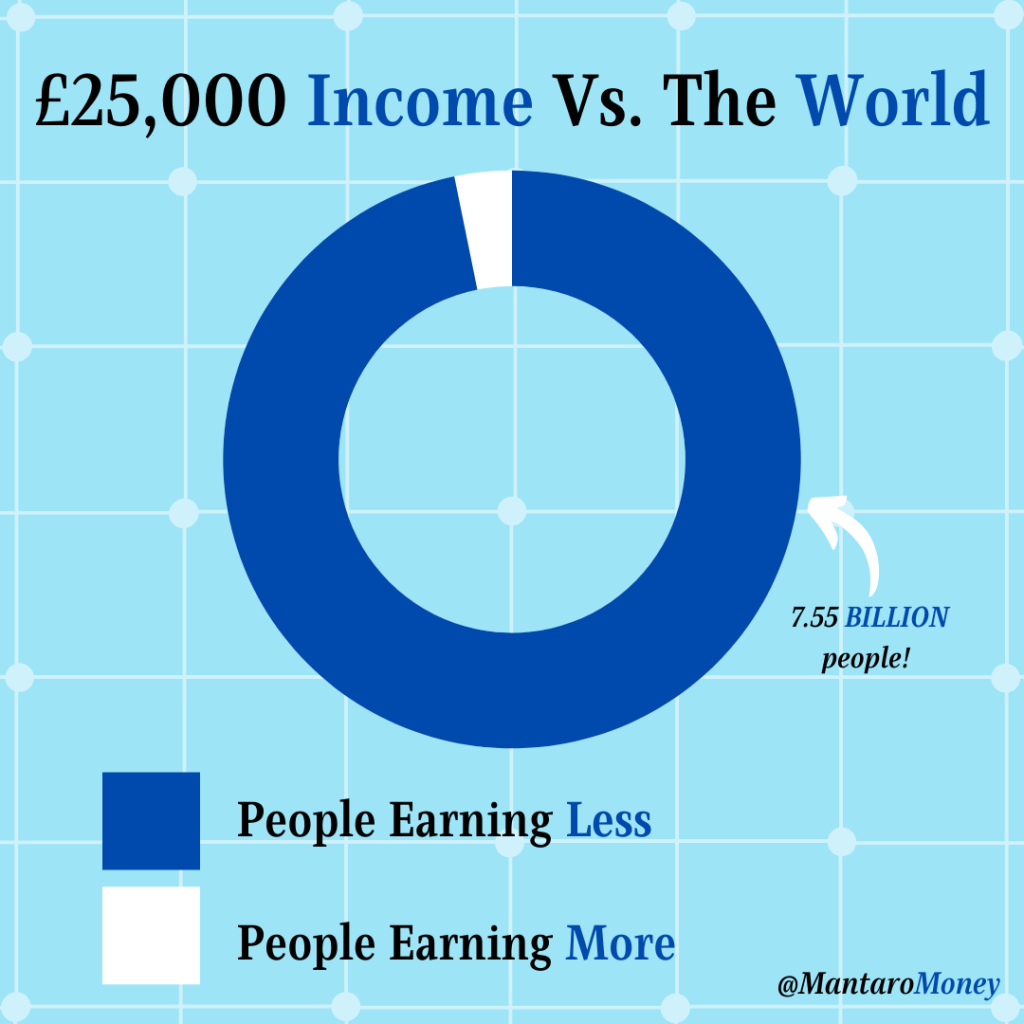
At £25,000 per year, only 3.2% of the global population earn more than you. 96.8% of the population earn less money than you – that is over 7.5 billion people!
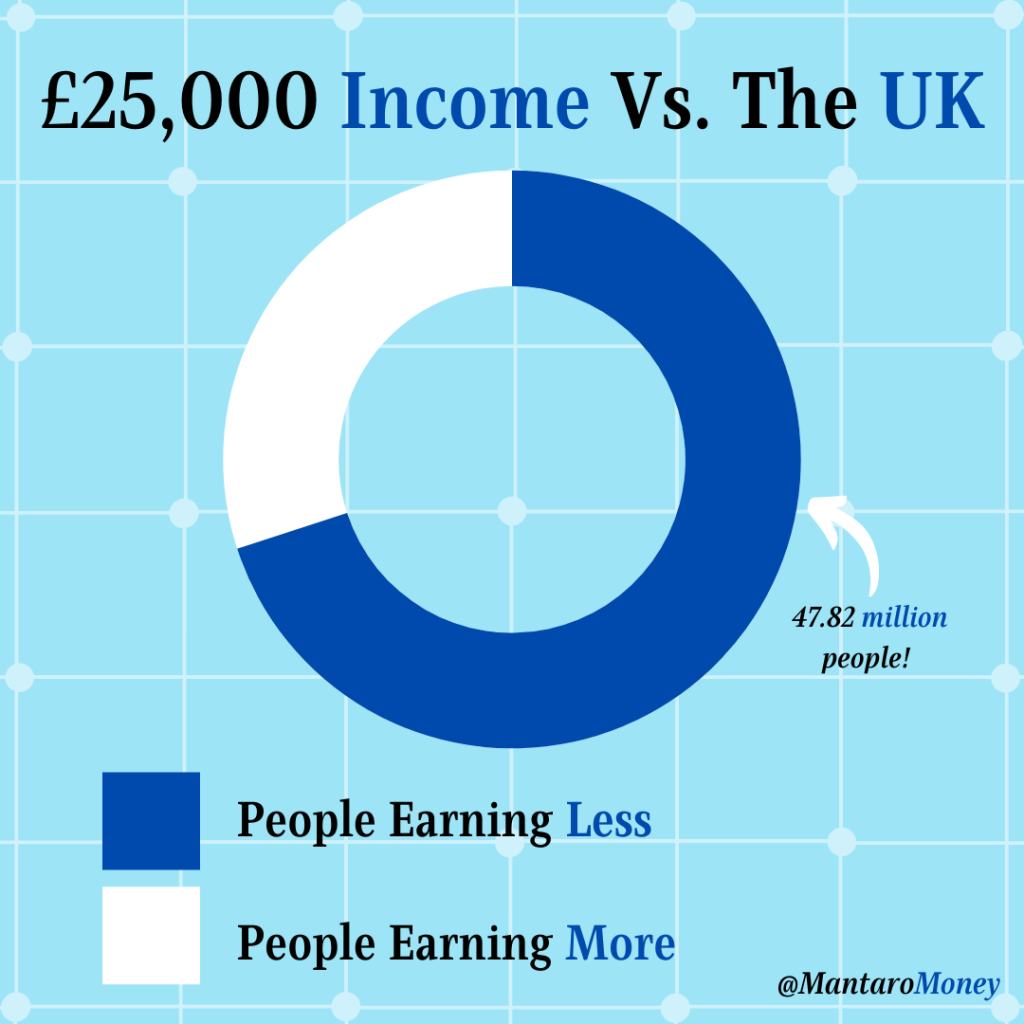
Now, before you say, ‘but the cost of living is higher in developed countries, £25,000 doesn’t get you far in the UK’, let me me tell you this; at £25,000 you are earning more than 70% of the UK population.
Feeling better about your situation? I hope so, otherwise this post isn’t doing its intended job!
Whilst upward comparison promotes jealously and envy, downward comparison is a powerful tool for generating gratitude – which is important for our personal wellbeing.
Next time you find yourself comparing upwards, being envious of another’s life or possessions, remember that there are potentially billions of people who would be envious of your life.
Now, I will concede that downward comparison may also prompt feelings of guilt, however I believe these to be unfounded.
We are all playing the cards we’ve been dealt, so do not feel guilty about where you land on the spectrum. Giving up your worldly possessions and moving somewhere to live on less than $1 per day wouldn’t help anyone!
Be grateful for your privileged position and use it as a catalyst for good, both internally and externally – I’ll leave it up to you as to how you go about that 😊
To finish, let’s leave income behind and look at how different UK households manage their assets. It should give you an idea as to where you are going right or wrong in your wealth building journey.

(The poorest households are on the left, with the wealthiest households on the right).
The striking difference is between physical assets vs business assets. The lowest percentiles have a huge chunk of wealth in physical assets, whilst the wealthiest of this nation own business assets.
Without going into too much detail, this is the key to becoming wealthy – you must own productive assets that make money for you. Check out my short post, Owner > Consumer to find out why.
Property makes up a large chunk of assets held, which isn’t surprising for the property-centric UK. Property has generally been great for most people, appreciating in value over time.
I’d like to see pensions making up a bigger chunk of overall assets, I believe the graph shows they are being under-utilised. A pension is a Wealth Creation Machine and should not be avoided.
The below graph again shows a huge disparity between the top and bottom households in the UK. It pains me to see zero-return assets and savings assets dominating the bottom half of the graph. Your money must be working for you if you wish to grow real wealth.

It is unsurprising to see the correlation between wealthy households and productive assets. Again, check out Owner > Consumer to find out more.
So, the moral of the story is:
- Stop comparing upwards if you want to be happy!
- Take a step back and gain perspective by comparing downwards.
- Wealthy households hold a high percentage of their net worth in productive assets.
- Poorer households hold their net worth in low or no return assets.
- Put your money to work if you want to build wealth.
Want to see where your income puts you? Check out these calculators:
Thanks for reading,
Tom Redmayne
Financial Planner-in-waiting
If you enjoy my content, please subscribe. You will get new posts straight into your inbox:
From Dawn till Dusk: A Lifetime Condensed into 24 hours
It is not that we have a short time to live, but that we waste a lot of it. Seneca Introduction What would your life look like if it was condensed down to 24 hours? Would you be happy with how you’d spent your day so far? Do the plans you have for the rest…
10 Numbers That Will Change Your Investing Perspective
When I was growing up I didn’t like numbers. They scared me. Now, however, I get it. Numbers are great. They are an efficient way to transmit information and show value (or lack thereof). In the financial world, numbers are thrown about endlessly and it can become a bit much! So, I thought I’d provide…
The UK’s ‘Not So Mini-Budget’: What it Means for You
What’s Happened? Liz Truss (our new PM) and Kwasi Kwarteng (our new chancellor) dropped an economic and political bomb on Friday (23/09/22). The aftershock of which could be felt for years to come. The bomb, which they are calling a ‘mini-budget’, is our first real introduction to ‘Trussonomics’. In summary, the plan is to borrow…
